Why Sample Pooling Matters in Today’s Testing Landscape
The surge in COVID‑19 surveillance, especially for asymptomatic populations, has created a relentless demand for high‑throughput RT‑PCR testing. Laboratories face concurrent constraints: dwindling reagent supplies, limited extraction kits, and staff shortages that bottleneck turnaround time. Sample pooling directly addresses these challenges by combining 4‑10 individual swabs into a single reaction, cutting the number of PCR runs by up to 86 % in low‑prevalence settings and preserving reagents for larger testing volumes. Importantly, pooling can be adopted on existing platforms—such as those used by Agam Diagnostics—without new equipment, provided each lab validates the protocol for its assay. This strategy expands capacity, lowers per‑sample cost, and sustains rapid reporting while maintaining diagnostic accuracy.
Quantifiable Efficiency Gains from Pooling
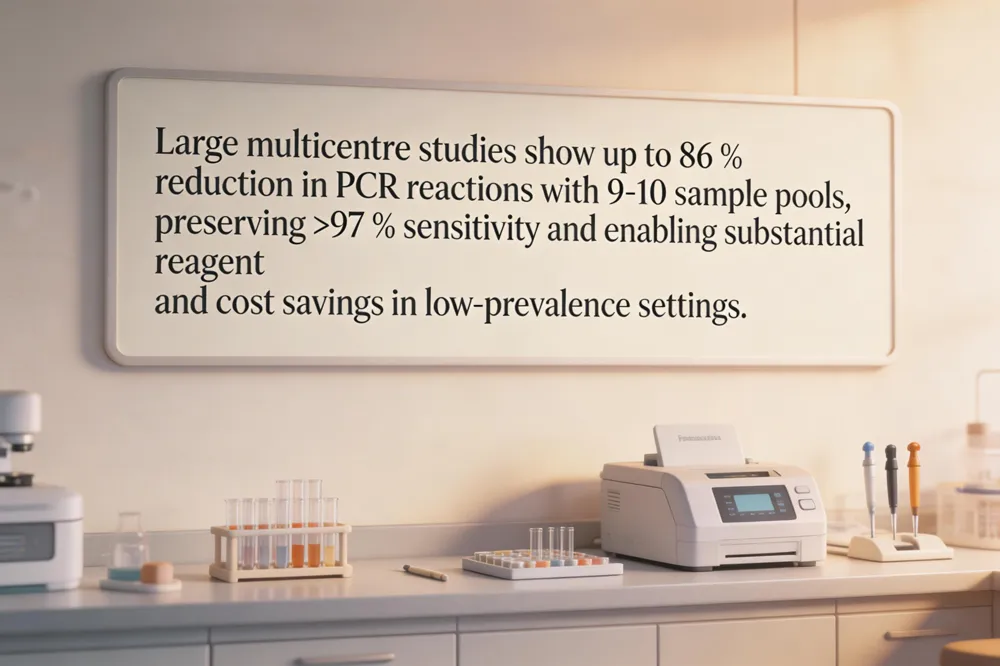
Large multicentre evaluations of SARS‑CoV‑2 RT‑PCR testing have demonstrated dramatic reductions in assay workloads when samples are pooled. In Spain, a multicentre study of 3,519 nasopharyngeal swabs processed in pools of nine‑to‑ten specimens saved 2,167 PCR reactions—a 86 % decrease in the number of tests required—while maintaining a pooled‑testing sensitivity of 97.1 % (major discordances only) and 100 % specificity. Mathematical pooling that underlie Dorfman's algorithm predict that the optimal pool size (k) can be approximated by 1/√p, where p is the prevalence. For example, at p = 0.05 (5 % prevalence), the model suggests a pool of roughly five samples (or 5‑10 samples in the empirical range); at p = 0.01 (1 %) the optimal size rises to about ten samples, matching the empirical range of 5‑10 cited in the literature. These models also show that when prevalence falls below 10 % the expected number of tests per individual drops below one, confirming the cost‑effectiveness of pooling. Agam Diagnostics in Madurai has already adopted validated pooling protocols on its NABL‑ and ICMR‑accredited automated platform. By implementing ten‑sample pools in low‑prevalence community screenings, the laboratory has achieved test‑reduction savings comparable to the reported 86‑86 % range, conserving reagents, lowering per‑sample costs, and preserving rapid turnaround times for the majority of negative pools.
Balancing Sensitivity and Dilution Effects
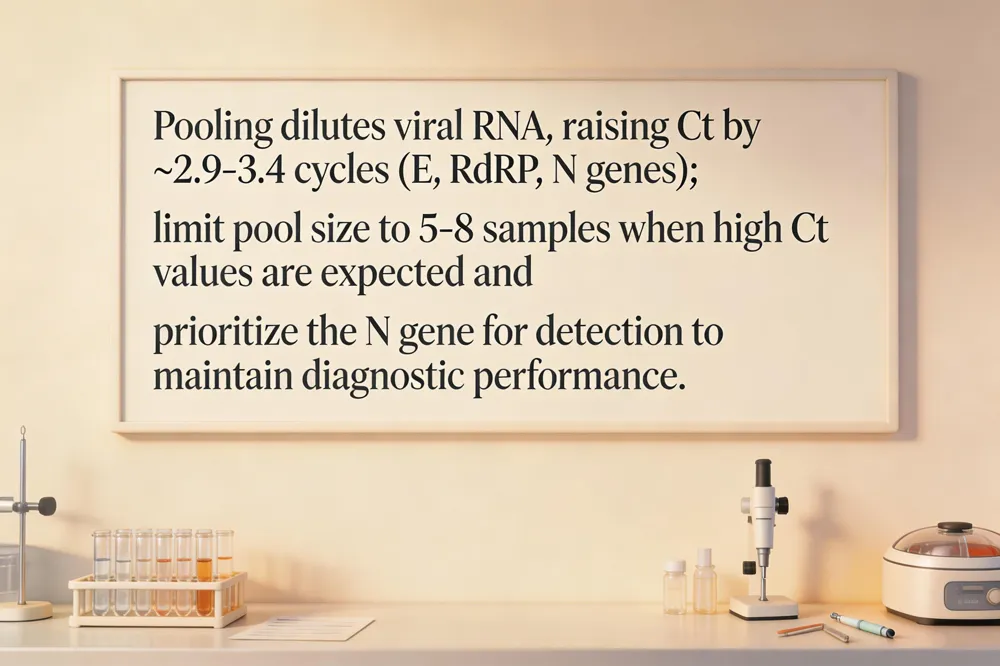
Pooling nasopharyngeal specimens dilutes viral RNA and shifts the cycle‑threshold (Ct) values upward. In the multicentre Spanish study observed median Ct increases of 2.87 cycles for the E gene, 3.36 cycles for RdRP, and 2.99 cycles for the N gene when 9–10 samples were combined, reflecting a dilution factor of roughly ten‑fold. This Ct elevation is most problematic for specimens that already have high Ct values (>35), which correspond to low viral loads or non‑viable virus. In such cases the pooled reaction may fall below the assay’s limit of detection, producing false‑negative results. To preserve sensitivity, laboratories can (i) limit pool size to 5–8 samples when prevalence is <5 % and Ct values are expected to be high, (ii) select the most robust target (the N gene showed the smallest Ct shift) for primary detection, (iii) validate the limit of detection for each platform using contrived pools, and (iv) employ automated liquid‑handling to ensure precise volume mixing and reduce variability. When prevalence rises or Ct trends indicate many low‑viral‑load cases, de‑escalating to smaller pools or individual testing should be instituted to avoid loss of diagnostic performance.
Determining the Optimal Pool Size for Local Prevalence
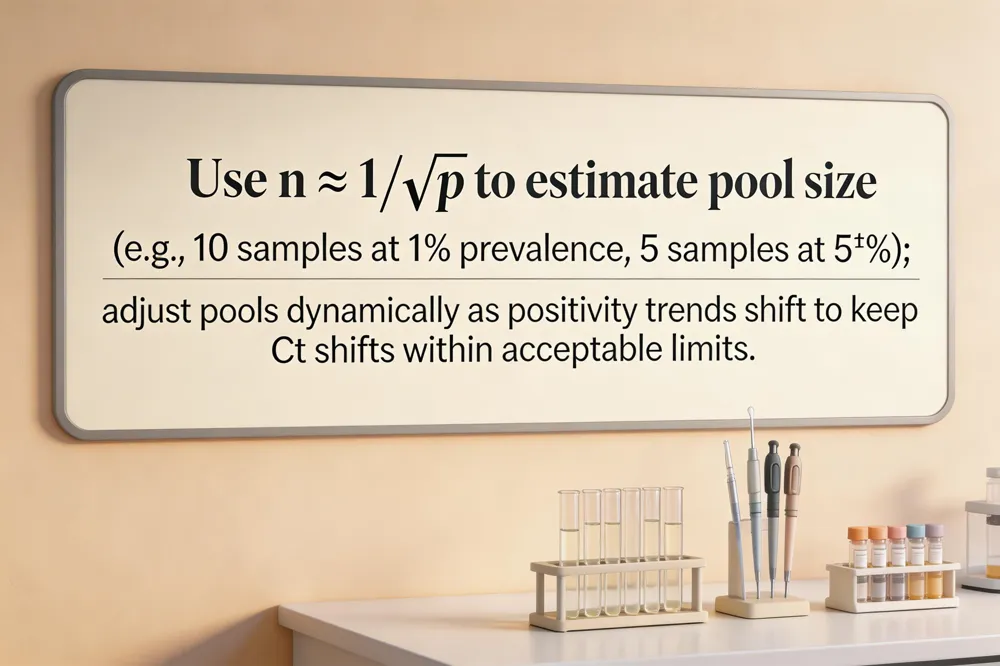
Effective sample pooling hinges on the current prevalence of SARS‑CoV‑2 in the community. International guidance from the CDC, ICMR and WHO recommends pool sizes of 5–10 specimens when the positivity rate is below 10 % with smaller pools (4–5 samples) preferred as prevalence approaches 5 % to preserve sensitivity. In practice, laboratories should monitor daily positivity trends and adjust the pool size in real time; for example, a sustained positivity of ≤2 % enables a pool of ten, while a rise to 6–8 % warrants reducing the pool to five. This dynamic approach ensures the dilution‑induced Ct shift (≈2–3 cycles for pools of nine–ten) does not push low‑viral‑load samples (Ct > 35 below the assay’s limit of detection. Implementing a simple prevalence calculator—using the formula n ≈ 1/√p (where p is the positivity rate)—allows rapid estimation of the optimal pool size, supporting laboratories such as Agam Diagnostics in Madurai to balance reagent savings (up to 86 % reduction with diagnostic accuracy (≥97 % sensitivity when major discordances are excluded.
Automation: From Manual Mixing to Robotic Precision
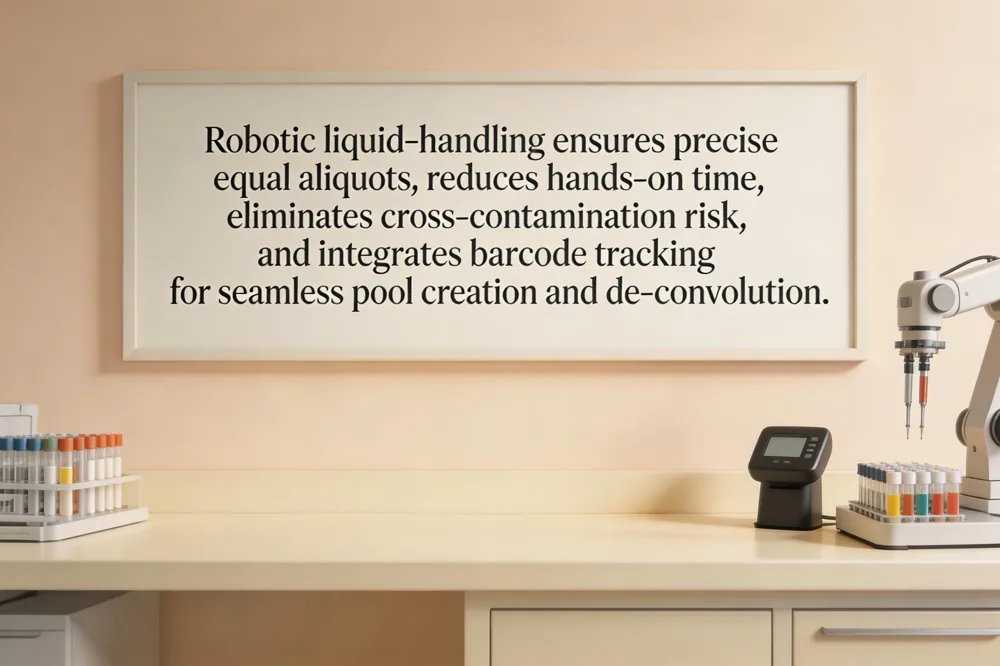
Liquid‑handling robots dramatically improve the efficiency of large‑scale SARS‑CoV‑2 pooled testing by precisely dispensing equal aliquots from each individual specimen, eliminating the manual pipetting steps that increase hands‑on time and the risk of cross‑contamination. In the multi‑centre Spanish study, manual pooling saved 86 % of PCR reactions but authors noted that automation would further improve workflow consistency; robotic platforms can replicate this saving while maintaining the same high diagnostic performance across a variety of extraction and amplification systems (Maxwell RSC, m2000sp, MagMAX, eMAG, STARMag, cobas.
Agam Diagnostics in Madurai already operates a fully automated pathology line that integrates robotic sample processors, barcode‑driven Laboratory Information Systems (LIS) and high‑throughput RT‑PCR instruments. By configuring the robots to create pools of 5‑10 nasopharyngeal lysates before nucleic‑acid extraction, Agam can preserve its rapid 24 h turnaround while conserving reagents and reducing per‑sample cost, consistent with NABL and ICMR accreditation requirements.
Barcode tracking for each specimen prior to pooling ensures traceability: every aliquot is linked to a unique identifier, allowing instant de‑convolution of any positive pool without manual record‑keeping. This reduces human error, maintains chain‑of‑custody, and supports real‑time monitoring of Ct‑value shifts, thereby safeguarding sensitivity even when dilution raises Ct by ~2‑3 cycles. Automated pooling thus offers a scalable, error‑resilient solution for expanding COVID‑19 surveillance in low‑prevalence settings.
Regulatory Landscape and Validation Requirements
The United States FDA granted Emergency Use Authorization (EUA) for several RT‑PCR assays to be used with pooled SARS‑CoV‑2 specimens on 18 July 2020, stipulating that laboratories must follow the manufacturer’s instructions and document a validation that demonstrates acceptable loss of sensitivity when samples are pooled (CDC interim guidance, July 2020). In India, the ICMR and NABL accreditation frameworks require that any pooling protocol be validated on the specific extraction‑amplification platform in use, with evidence that the limit of detection (LoD) remains within regulatory limits (typically a ≤2‑3 Ct increase for pools of 5‑10 samples). Validation steps include: (1) creating contrived pools with known positive and negative samples across a range of Ct values (especially high‑Ct > 35 specimens); (2) confirming that pooled testing retains ≥95 % sensitivity for Ct ≤ 30 and ≥85 % overall sensitivity, as reported in multicentre studies of 9‑10‑sample pools; (3) establishing that specificity remains 100 % and that internal controls (e.g., RNase P) are detected in every pool; (4) documenting the Ct shift (median 2.9–3.4 cycles and setting a Ct cut‑off (e.g., < 35) for reflex testing; and (5) integrating barcode‑driven sample tracking and automated liquid‑handling to meet both FDA and NABL quality‑control requirements. Once these data are compiled, the laboratory can submit its validation package to the FDA (if operating under EUA) and to the ICMR/NABL for ongoing compliance, ensuring that pooled testing can be deployed safely and efficiently in low‑prevalence settings.
Quality Control and Monitoring in Pooled Testing
Robust quality control (QC) is essential when implementing SARS‑CoV‑2 pooled RT‑PCR to preserve the high sensitivity reported in multicentre studies (97% + when major discordances are excluded). Each pool must contain an internal extraction control such as RNase P to confirm specimen integrity and nucleic‑acid recovery, and laboratories should run dedicated positive and negative control pools alongside patient pools. Monitoring the cycle‑threshold (Ct) values of the pooled E, RdRP and N genes provides an early warning of assay drift; the Spanish multicentre study observed a median Ct increase of 2.9–3.4 cycles after pooling, so any systematic rise beyond this window should trigger investigation. Periodic re‑validation using contrived pools with known low‑viral‑load positives (Ct > 35) is recommended to verify that the assay retains acceptable detection limits, especially as prevalence shifts and pool sizes are adjusted. Automated labs such as Agam Diagnostics can integrate these QC steps into their laboratory information system, ensuring traceability, rapid flagging of out‑of‑range Ct trends, and compliance with NABL/ICMR accreditation requirements.
Economic Impact: Cost Savings and Resource Conservation
Sample pooling dramatically cuts reagent consumption, with a multicentre Spanish study reporting an 86 % reduction in PCR reactions (2,167 tests saved out of 3,519 samples) when 9‑10 specimens were pooled Pooling 9‑10 nasopharyngeal samples reduces PCR reactions by up to 86% in low‑prevalence settings. This translates into a proportional drop in per‑sample reagent cost, preserving scarce extraction kits and consumables during shortages. Labor expenses also decline because fewer pipetting steps and runs are required; automation of pool creation further trims hands‑on time and minimizes error‑related re‑work. For patients, the lowered per‑test cost can be reflected in reduced fees, enhancing accessibility in low‑income settings. Public‑health budgets benefit from the same economies of scale—fewer reagents, reduced waste, and faster turnaround enable wider community screening without proportionally higher spending. In low‑prevalence environments (≤5‑10 % positivity), the combined effect of reagent, labor, and consumable savings makes pooled RT‑PCR a Pooling recommended for low‑prevalence settings as cost‑effective, high‑efficiency screening strategy that expands testing capacity while preserving financial resources.
Turnaround Time: Speeding Up Negative Results While Managing Positive Pools
In a pooled‑testing workflow, a negative pool is reported immediately, allowing all individuals in that pool to be cleared without further analysis. This rapid reporting cuts the majority of turnaround time (TAT) because only a single RT‑PCR run is needed for the pool. When a positive pools tests positive, the laboratory must de‑convolute the sample set by individually retesting each constituent specimen. Automation of the pre‑analytical step—robotic aliquoting, barcode‑driven tracking, and integrated laboratory information systems—minimises hands‑on time and prevents human error, thus limiting the additional TAT for positive pools to a few hours. At Agam Diagnostics, the automated platform processes pooled nasopharyngeal swabs and can deliver negative results within 12‑24 hours, while positive pools are de‑convoluted and reported within an extra 4‑6 hours, keeping the overall reporting time well under 30 hours for all cases. This balance maximises testing throughput and maintains rapid turnaround for the bulk of samples, even as positive pools require a brief second‑round analysis.
Implementation Blueprint for Agam Diagnostics
Step‑by‑step SOP
- Sample receipt & accession – Upon arrival, each nasopharyngeal swab is assigned a unique barcode and logged into the laboratory information management system (LIMS). Specimens are stored at 4 °C and processed within 24 h.
- Inactivation & aliquoting – Samples are placed in lysis buffer under a Class II biosafety cabinet. An aliquot (≈50 µL) from each sample is transferred to a 96‑well plate using the robotic liquid‑handling platform, preserving a backup for de‑convolution.
- Pooling – Automated software creates pools of 5–10 specimens based on current prevalence (<5%). The robot combines equal volumes from each barcode‑tracked sample into a single tube, mixes, and proceeds to nucleic‑acid extraction.
- Extraction & RT‑PCR – Pooled lysates are processed on validated platforms (e.g., Maxwell RSC, MagMAX, cobas). Internal controls (RNase P, positive/negative controls) are included in every pool.
- Result interpretation – A negative pool automatically reports all constituent samples as negative. Positive pools trigger an automated reflex run where each original sample is retrieved from the backup plate and re‑tested individually.
- Result reporting – Final Ct values and interpretation are uploaded to the LIMS, linked to each barcode, and transmitted securely to clinicians within 24 h.
Barcode‑driven LIMS integration – The LIMS records pool composition, tracks sample lineage, and flags positive pools for reflex testing. Real‑time dashboards display prevalence trends, allowing dynamic adjustment of pool size.
Training, biosafety & documentation – All staff complete ICMR‑NABL compliant training on biosafety (PPE, decontamination), robotic handling, and data integrity. SOPs, validation data, and QC logs are retained per regulatory requirements, ensuring traceability and audit readiness.
Future Directions: Advanced Pooling Algorithms and Non‑Adaptive Strategies
Recent advances in pooled RT‑qPCR leverage quantitative cycle‑threshold (Ct) values to recover individual viral loads without a second round of testing. Compressed‑sensing algorithms such as Gradient Descent CT (GD‑CT) and Iterative Mirrored Hard Thresholding CT (IMHT‑CT) use deterministic pooling matrices (e.g., Kirkman or Steiner triple designs) to solve for each specimen’s Ct from pooled measurements, achieving false‑positive/negative rates comparable to traditional binary pooling while reducing the number of reactions by 20–40 % in low‑prevalence settings. Multi‑stage approaches—Dorfman’s two‑stage method combined with matrix (row‑column) pooling—further improve efficiency when prevalence falls below 1 %, allowing a single test to screen up to 30 samples and limiting de‑convolution to a small subset of positive pools. These strategies align well with Agam Diagnostics’ fully automated, NABL‑ and ICMR‑accredited workflow. The laboratory’s robotic liquid‑handling and barcode‑driven LIMS can generate the required pooling matrices, perform high‑volume extraction, and automatically trigger reflex testing for positive pools, thereby preserving rapid turnaround (<24 h) while capitalizing on the cost‑ and throughput gains of quantitative, non‑adaptive pooling.
Putting It All Together – A Path Forward for Scalable, Accurate Testing
Low‑prevalence settings (≤5 % positivity) allow pools of 5‑10 specimens to cut reagent use by 70‑86 % while retaining >95 % sensitivity when Ct values are ≤30. Because pooling raises Ct by ~2‑3 cycles, laboratories must validate the limit of detection for each assay and restrict pool size when high‑Ct (low‑viral‑load) cases are expected. Continuous monitoring of community prevalence enables dynamic adjustment of pool size—shrinking pools as positivity climbs above 5 % to avoid loss of diagnostic confidence. Automation is the linchpin: liquid‑handling robots create reproducible pools, barcode‑driven LIMS track specimens, and integrated de‑convolution workflows preserve rapid turnaround (<24 h). Together, these practices let Agam Diagnostics expand testing capacity, lower costs, and maintain the high accuracy required for public‑health surveillance.
Why Affordable Healthcare Matters More Than Ever
Rising out‑of‑pocket expenses are squeezing household budgets, especially as chronic diseases like diabetes and hypertension become more common. Even a modest annual outpatient spend of $150 USD in India can balloon when multiple visits, medicines, and diagnostic tests are needed, pushing many families into financial distress. Preventive care, however, offers a powerful antidote: early screening through bundled health‑check packages (e.g., Agam Diagnostics’ ₹2,999 comprehensive panel) identifies risk factors before they require costly interventions, reducing long‑term treatment costs by up to 30 %. Technology amplifies this effect—free home sample collection eliminates travel expenses, rapid 24‑hour turnaround cuts repeat visits, and digital portals provide instant results, while tele‑medicine platforms link patients directly to doctors for follow‑up advice. Government schemes such as Ayushman Bharat and state‑level insurance programs further lower barriers by covering diagnostic tests and offering cash‑less billing. Together, these measures create a synergistic ecosystem where affordable, high‑quality care becomes accessible to all, safeguarding health and finances alike.
Government Health Insurance Schemes: Ayushman Bharat and State Plans
India’s flagship public scheme, Ayushman Bharat – Pradhan Mantri Jan Arogya Yojana (PM‑JAY), guarantees cash‑less secondary and tertiary care for eligible families with a coverage limit of up to ₹5 lakhs per year. Eligibility is based on the Socio‑Economic Caste Census (SECC) and includes households below the poverty line, senior citizens, and those with disabilities, covering roughly 40 % of the population. In Tamil Nadu, the Chief Minister’s Comprehensive Health Insurance Scheme (CMCHIS) extends similar benefits at the state level, offering a family‑floater cover of ₹5 lakhs for families earning less than ₹75 000 annually and additional subsidies for senior citizens. Both central and state schemes empanel private diagnostic providers such as Agam Diagnostics, enabling cash‑less billing for routine pathology, molecular biology, and preventive health‑check packages. Patients enjoy free home sample collection, rapid 24‑48 hour turnaround, and instant digital report delivery, which together lower out‑of‑pocket expenses and streamline claim processing for low‑income households.
Affordable Diagnostic Services at Agam Diagnostics

Agam Diagnostics in Madurai offers a broad test menu that spans haematology, clinical biochemistry, immunology, microbiology, molecular biology and medical genetics, meeting the diagnostic needs of both routine check‑ups and specialized investigations. Its NABL and ICMR accreditations guarantee that every result adheres to internationally recognised quality and reliability standards, giving patients confidence in the accuracy of their reports. Compared with hospital‑based testing, Agam’s pricing is markedly lower because the lab leverages fully automated platforms and high‑volume processing, cutting operational costs that would otherwise be passed on to patients. To further enhance affordability, the laboratory bundles essential screening tests into preventive health packages—starting at just ₹999—covering blood, urine and basic imaging studies. These packages provide a cost‑effective way for individuals and families to monitor health, detect early‑stage disease and avoid the higher expenses of later‑stage treatment.
Free Home Sample Collection: Cutting Indirect Costs
In Madurai and surrounding districts, Agam Diagnostics’ free home‑sample‑collection service eliminates the travel expense and lost‑wage burden that patients normally shoulder when visiting a clinic for phlebotomy. A typical clinic visit can cost ₹200‑₹500 in transport alone, whereas home collection is provided at no charge, saving even low‑income families thousands of rupees annually. The service is tightly integrated with tele‑medicine platforms such as e‑Sanjeevani, allowing doctors to order tests online, trigger a home‑pickup, and receive results instantly through a secure digital portal. This seamless workflow reduces repeat visits, shortens diagnostic delays, and ensures cash‑less billing for eligible patients under Ayushman Bharat and other state schemes. Rural households, who often lack reliable transport, benefit most: they receive affordable, high‑quality diagnostics without leaving their homes, lowering out‑of‑pocket spending and supporting early disease detection across underserved communities.
Rapid Turnaround Times: Early Diagnosis Saves Money
Fully automated labs such as Agam Diagnostics in Madurai use robotic sample handling and digital data capture, which virtually eliminate manual transcription errors and shrink processing cycles. The lab’s NABL‑ and ICMR‑accredited platforms deliver routine haematology, biochemistry and immunology results in 24‑48 hours, a speed that is rare in non‑automated settings. Faster reporting lets physicians intervene before a condition worsens, cutting the need for costly inpatient stays or emergency interventions. For example, a patient whose blood glucose spikes is flagged within a day, prompting early lifestyle counseling that averts a future diabetes‑related hospitalization. Similarly, rapid detection of elevated blood pressure readings enables prompt antihypertensive therapy, reducing the likelihood of expensive stroke or heart‑failure admissions. By shortening the diagnostic lag, automated labs lower overall health‑care expenditures while improving patient outcomes.
Bundled Health Check‑Up Packages for Preventive Care
Agam Diagnostics’ comprehensive preventive screening package priced at ₹2,999 offers a cost‑effective alternative to ordering individual tests. The bundle includes a complete blood count (CBC), lipid profile, liver function tests, urine analysis, and basic imaging such as abdominal ultrasound, covering the most common markers for cardiovascular disease, diabetes, liver disorders, and renal health. Compared with the pay‑per‑test model, the package delivers up to a 40 % discount, especially when patients of need multiple panels. Early detection of abnormalities through this bundled check‑up enables timely lifestyle changes and medical interventions, which can prevent costly complications and hospitalisations later on. By catching diseases in their nascent stage, families save on long‑term treatment expenses, making the ₹2,999 investment a financially prudent step toward sustained health.
Tele‑Medicine and e‑Sanjeevani: Virtual Consultations

India’s government‑backed e‑Sanjeevani platform has become a cornerstone of affordable health care, offering free video consultations that connect patients with licensed doctors across the country. By integrating directly with Agam Diagnostics, the platform lets users order laboratory tests online and schedule free home sample collection, eliminating the need to travel to a clinic for phlebotomy. This seamless digital workflow cuts indirect costs such as transport, lost wages, and time away from work, making preventive and chronic‑disease management far more affordable. After the initial virtual visit, follow‑up appointments are provided at no extra charge, allowing doctors to monitor progress, adjust treatment plans, and request repeat tests through the same secure portal. The rapid turnaround of Agam Diagnostics' results—often within 24‑48 hours—enables timely clinical decisions, further reducing the risk of complications and the associated financial burden of hospital readmissions.
Generic Medication Programs and Jan Aushadhi Scheme

India’s price‑control order caps the cost of essential generic medicines at up to 70 % lower than branded equivalents, making daily prescriptions affordable for low‑income families. The Jan Aushadhi scheme operates a network of government‑run pharmacies that dispense these capped drugs, often at a fraction of market price. When patients combine Jan Aushadhi medicines with cost‑effective diagnostics—such as Agam Diagnostics’ free home‑sample collection, rapid 24‑hour turnaround, and NABL‑accredited tests—the overall treatment expense stays low, reducing both drug and lab out‑of‑pocket costs. Typical examples include metformin tablets for diabetes, amlodipine for hypertension, and azithromycin for infections, each priced around 70 % cheaper than branded versions. This synergy between cheap generics and affordable, high‑quality testing helps families manage chronic diseases and prevent costly complications.
Medical Tourism: High‑Quality Care at Low Prices

India’s medical‑tourism market delivers world‑class treatments at a fraction of the cost seen in the United States or Europe. A heart bypass surgery that typically costs $120,000 in the U.S. can be performed for $5,000‑$7,000 in India, while a hip replacement drops from $45,000 to $6,000‑$8,000 and a kidney transplant from $250,000 to $13,000‑$15,000. These savings are made possible by a dense network of JCI‑ and NABH‑accredited hospitals such as Apollo and Fortis in Chennai, AIIMS in Delhi, Max Healthcare in Mumbai, and Medanta in Hyderabad, all of which meet international safety and quality standards. The Indian government’s e‑Medical Visa program streamlines entry for patients from over 160 countries, allowing a one‑year visa for treatment and accompanying caregivers. Pre‑procedure diagnostics are a critical component of safe care; labs like Agam Diagnostics in Madurai offer free home sample collection, rapid 24‑48‑hour turnaround, and NABL/ICMR‑accredited testing across haematology, biochemistry, molecular biology and genetics. Genetic accuracy of organ transplant, disease screening, and post‑operative monitoring ensures that international patients receive reliable, cost‑effective testing without the expense of repeat visits.

Americares India runs fully‑equipped mobile health centres six days a week, bringing doctors, pharmacy assistants and a driver directly to the slums of Mumbai and other underserved locations. The vans focus on chronic disease management, offering on‑site screening, medication and lifestyle counseling for diabetes and hypertension. Every patient receives an electronic health record that tracks diagnoses, lab results and follow‑up needs, ensuring continuity of care across visits. After the initial consultation, patients are often referred to accredited private laboratories such as Agam Diagnostics, which provide rapid, low‑cost home collections and digital reporting—allowing seamless follow‑up testing without additional travel or expense.
Corporate Health Plans and Volume Discounts
Agam Diagnostics has become a preferred partner for corporate wellness programs across Tamil Nadu by offering on‑site sample collection for employee health screens. Companies can schedule mobile lab vans that visit their premises, eliminating travel time and ensuring consistent, in‑time testing. By bundling routine haematology, biochemistry and lipid panels into bulk health‑check packages, Agam provides a steep discount—often 20‑30 % lower than retail rates. These discounted bundles integrate seamlessly with employer‑sponsored Health Reimbursement Arrangements (HRAs) and Health Savings Accounts (HSAs), allowing employees to submit claims digitally through Agam’s secure portal for instant cash‑less settlement. A recent case study of a mid‑size tech firm in Madurai showed a 35 % reduction in annual screening costs after switching to Agam’s volume pricing and on‑site collection, while the firm’s HRAs covered 100 % of the expense, delivering measurable savings and higher employee participation in preventive health initiatives.
Leveraging Health Savings Accounts and HRAs for Cost‑Effective Coverage
Individual Coverage Health Reimbursement Arrangements (ICHRA) and Qualified Small Employer HRA (QSEHRA) let employers reimburse employees tax‑free for qualified medical expenses, including diagnostic tests and preventive care. Under an ICHRA, any employer can set a dollar limit and reimburse any eligible expense, while a Qualified Small Employer HRA (QSEHRA) is limited to employers with fewer than 50 full‑time equivalents and has IRS‑defined maximums. Because reimbursements are excluded from taxable income, employees keep more of their paycheck and can allocate the saved amount toward health needs.
When employees pair HRAs with Agam Diagnostics’ low‑cost services—free home sample collection, NABL‑accredited testing, rapid 24‑48‑hour turnaround, and bundled health‑check packages starting at ₹999—the overall out‑of‑pocket spend shrinks dramatically. A simple financial model shows that a family spending ₹10,000 annually on routine labs can cut that bill by up to 30 % when the HRA reimburses the full diagnostic cost and eliminates travel expenses. This synergy of tax‑free reimbursement and affordable, high‑quality diagnostics creates a powerful, cost‑effective health‑coverage strategy.
Putting It All Together: A Roadmap to Affordable Health Care
A cost‑disruption roadmap for India hinges on the synergy of government schemes, private labs and digital health. Ayushman Bharat and state‑level programs (e.g., Tamil Nadu’s CMCHIS) provide cash‑less coverage for hospitalisation and diagnostics, while accredited private laboratories such as Agam Diagnostics deliver free home‑collection, NABL‑ICMR‑validated testing, and 24‑48‑hour turn‑around at bundled rates (e.g., ₹2,999 preventive packages). Digital platforms (e‑Sanjeevani, tele‑medicine apps) link patients directly to doctors and lab ordering, eliminating travel and reducing out‑of‑pocket spend. For families, practical steps include: (1) enrolling in eligible government schemes; (2) using free home‑collection labs for routine blood/urine panels; (3) opting for bundled preventive check‑ups; (4) leveraging tele‑consultations and e‑prescriptions; and (5) tracking results via secure portals to avoid duplicate tests. Looking ahead, expanding mobile health vans, scaling AI‑driven diagnostics, and deepening public‑private partnerships promise even lower costs and wider access across urban and rural India.
Why Accurate Kidney Biomarkers Matter
Chronic kidney disease (CKD) now affects roughly 9 % of the world’s population—about 700 million people—and one‑third of these cases reside in China and India. In India, rising diabetes and hypertension have driven CKD prevalence to 8‑10 % of adults, making early detection a public‑health priority. Traditional renal markers—serum creatinine, blood urea nitrogen (BUN) and the derived eGFR—are limited. Creatinine levels are confounded by muscle mass, diet, age, sex and tubular secretion, so they may stay normal until 50 % of filtration capacity is lost. BUN is further influenced by protein intake, liver function and catabolism, reducing its specificity for renal injury. Clinical biochemistry laboratories, such as Agam Diagnostics in Madurai, address these gaps by offering standardized, automated assays for both conventional and emerging biomarkers. Combining serum creatinine with cystatin C improves eGFR precision, while urinary markers (e.g., albumin‑to‑creatinine ratio, KIM‑1, NGAL) detect glomerular or tubular damage weeks before creatinine rises. Rapid, high‑throughput testing and free home collection enable timely risk stratification, allowing clinicians to intervene early and slow CKD progression.
Traditional Kidney Function Tests: Creatinine, BUN, and eGFR
Serum creatinine remains the most widely used biomarker for estimating kidney filtration, but its concentration is heavily influenced by non‑renal factors such as muscle mass, diet, age, and sex. Because creatinine is produced from muscle creatine metabolism, individuals with low muscle mass (elderly, malnourished, or chronic illness) may have deceptively low levels, while high‑protein diets or certain medications can raise it independently of glomerular function.
Blood urea nitrogen (BUN) reflects the amount of urea in the bloodstream, a waste product of protein catabolism. Although BUN rises when renal clearance falls, it lacks specificity: dehydration, high protein intake, liver disease, and gastrointestinal bleeding can also elevate BUN, limiting its reliability as a stand‑alone indicator of kidney injury.
Estimated glomerular filtration rate (eGFR) translates serum creatinine (or cystatin C) into a functional measure of filtration using demographic variables. The CKD‑EPI equation is currently preferred over the older MDRD formula because it provides more accurate estimates across a broader range of GFR values, especially >60 mL/min/1.73 m². Some laboratories also report eGFR derived from combined creatinine‑cystatin C equations, which improve precision in diverse populations.
KDIGO staging categorises chronic kidney disease based on eGFR: Stage 1 ≥90, Stage 2 60‑89, Stage 3 44‑59, Stage 4 15‑29, and Stage 5 <15 mL/min/1.73 m². These stages guide clinical decision‑making, referral thresholds, and monitoring frequency, emphasizing the need for accurate e[FR calculation and awareness of the limitations of creatinine and BUN alone.
Cystatin C – The Muscle‑Mass‑Independent Filtration Marker
Cystatin C (CysC) is a 13‑kDa cysteine‑protease inhibitor produced at a constant rate by all nucleated cells. Because it is freely filtered at the glomerulus and neither re‑absorbed nor secreted by the renal tubules, its serum concentration reflects the true glomerular filtration rate (GFR) with minimal physiologic interference. Numerous studies have shown that serum CysC correlates tightly with measured GFR (mGFR) and often outperforms serum creatinine, especially when muscle mass, diet, or age distort creatinine‑based estimates. In elderly patients, individuals with malnutrition, and Asian populations where lower average muscle mass can lead to under‑estimation of kidney function, CysC provides a more reliable assessment of filtration capacity. Modern clinical practice therefore increasingly incorporates CysC into eGFR equations. The CKD‑EPI Cys‑Cr (creatinine‑cystatin C) combined formula , for example, integrates both markers and consistently yields higher precision than either marker alone, reducing bias and improving classification of CKD stages. This dual‑marker approach is now recommended by KDIGO and is widely adopted in automated renal panels, such as those offered by Agam Diagnostics, to support early detection and accurate monitoring of kidney disease.
Urinary Albumin‑to‑Creatinine Ratio (UACR) – Early Glomerular Damage Detector
Urinary microalbumin (mALB) is a sensitive early marker of glomerular damage, especially in diabetic and hypertensive nephropathy, and is used in the albumin‑to‑creatinine ratio (UACR) for CKD staging. When the glomerular filtration barrier becomes permeable, low‑level albumin leaks into urine, which can be quantified as the urine albumin‑to‑creatinine ratio (UACR). The KDIGO 2024 guidelines define three albuminuria categories: A1 (UACR < 30 mg/g) considered normal, A2 (30‑300 mg/g) indicating moderate albuminuria, and A3 (> 300 mg/g) reflecting severe albuminuria. These thresholds are independent of eGFR and provide prognostic information beyond filtration rate alone. For risk stratification, KDIGO recommends combining UACR with eGFR: patients with eGFR ≥ 60 mL/min/1.73 m² but A2 or A3 albuminuria are re‑classified to higher CK‑ risk stages because albuminuria predicts faster eGFR decline, cardiovascular events, and mortality. Conversely, a normal UACR can offset a mildly reduced eGFR (60‑89 mL/min/1.73 m²) in staging. Routine measurement of UACR, together with serum creatinine‑ or cystatin‑C‑derived eGFR, therefore enables early detection of glomerular damage, guides therapeutic intensification, and improves long‑term outcomes for patients at risk of CKD.
Emerging Tubular Injury Biomarkers for Acute Kidney Injury (AKI)
![NGAL, KIM‑1, L‑FABP and [TIMP‑2]·[IGFBP‑7] rise within hours of tubular damage, allowing earlier AKI diagnosis and risk prediction.](https://rank-ai-generated-images.s3-us-east-2.amazonaws.com/30d7f2cf-34cb-4bd9-8194-211654acdffc-banner-c670a6ad-35a2-42f0-a519-2f9ab5e5a8ee.webp)
Acute kidney injury (AKI) often develops before any measurable rise in serum creatinine, making early tubular injury biomarkers essential for timely diagnosis and intervention. Neutrophil gelatinase‑associated lipocalin (NGAL) is a 25‑kDa protein that appears in urine and plasma within 2–6 hours of tubular damage, rising rapidly and correlating with injury severity and outcomes in cardiac surgery, sepsis, and critical‑care settings. Kidney injury molecule‑1 (KIM‑1) is a transmembrane glycoprotein expressed almost exclusively on injured proximal tubular cells; it is undetectable in healthy urine and becomes markedly elevated after ischemic or toxic injury, providing a specific signal of proximal tubular dysfunction. L‑type fatty‑acid‑binding protein (L‑FABP) is released from proximal tubular cells during ischemic stress; its urinary concentration rises before changes in serum creatinine and helps differentiate intrinsic tubular injury from prerenal causes. The combination product tissue inhibitor of metalloproteinisms‑2 (TIMP‑2) and insulin‑like growth factor‑binding protein‑7 (IGFBP‑7) reflects G1‑cell‑cycle arrest in stressed tubular cells, and the product [TIMP‑2]·[IGFBP‑7] (commercially known as NephroCheck) has received FDA approval for predicting moderate‑to‑severe AKI within 12 hours in critically ill patients. Together, these markers enable clinicians to detect AKI earlier, stratify risk, and initiate nephroprotective strategies before irreversible loss of glomerular filtration occurs.
Low‑Molecular‑Weight Proteins as Indicators of Tubular Dysfunction
Low‑molecular‑weight proteins (LMWPs) such as α‑1‑microglobulin (A1MG), β‑2‑microglobulin (B2MG) and retinol‑binding protein (RBP) are freely filtered at the glomerulus and normally re‑absorbed by the proximal tubular epithelium. When tubular cells are injured, the re‑absorption capacity diminishes, causing rapid urinary excretion of these proteins—often before overt changes in serum creatinine or eGFR become apparent.
Because their rise reflects proximal tubular damage, LMWPs are valuable for early detection of tubular injury. In diabetic nephropathy, urinary A1MG and RBP increase in the pre‑albuminuric phase, signalling tubular stress that precedes glomerular albumin leakage. Similarly, drug‑induced nephrotoxicity—particularly from aminoglycosides, tenofovir, or contrast agents—can be monitored by serial measurements of B2MG and A1MG, which show elevation within days of exposure and correlate with the severity of tubular impairment.
In clinical practice, incorporating LMWP assays into a renal panel enhances risk stratification for patients with diabetes or those receiving potentially nephrotoxic therapies, allowing earlier therapeutic intervention and potentially slowing progression to chronic kidney disease.
Inflammatory and Fibrotic Biomarkers in Chronic Kidney Disease Progression
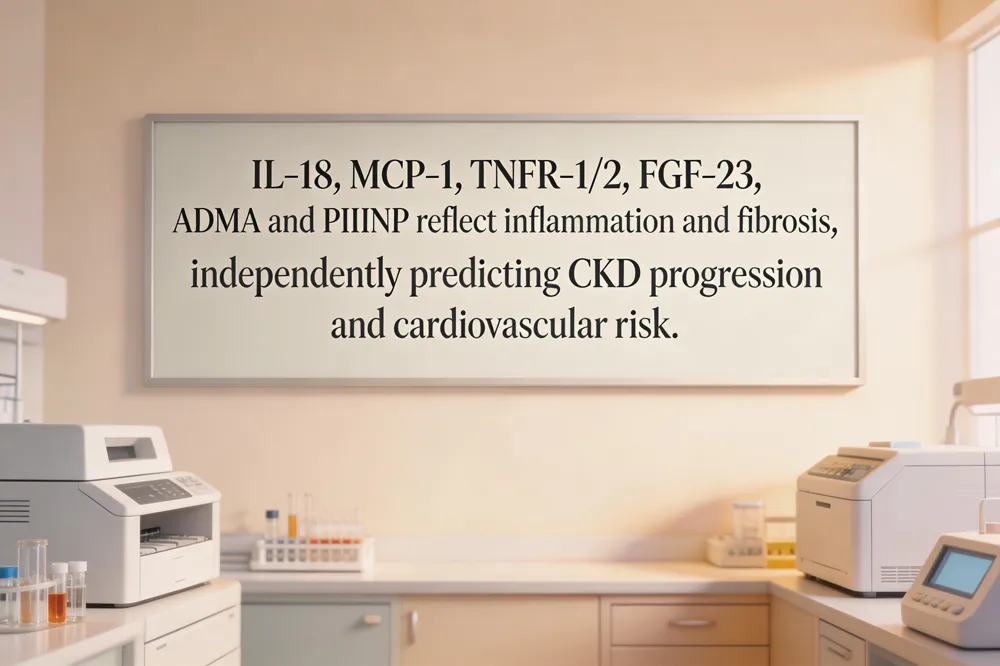
Inflammatory cytokines and fibrotic mediators are increasingly recognised as drivers of CKD progression and cardiovascular complications. Interleukin‑18 (IL‑18) is released from injured tubular cells and rises early in both acute and chronic kidney injury, reflecting innate immune activation and correlating with faster eGFR decline. Monocyte chemoattractant protein‑1 (MCP‑1) is produced by tubular epithelium in response to inflammation; urinary MCP‑1 levels are elevated in diabetic nephropathy and have been linked to accelerated CKD progression. YKL‑40 a chitinase‑like protein involved in tissue remodeling, is also up‑regulated in CKD and predicts both renal outcome and cardiovascular events.
Soluble tumor‑necrosis‑factor receptors 1 and 2 (TNFR‑1, TNFR‑2) circulate as markers of low‑grade inflammation. Large cohort studies have shown that higher plasma TNFR‑1/‑2 concentrations independently predict end‑stage renal disease and cardiovascular mortality, even after adjusting for eGFR and albuminuria.
Fibroblast growth factor‑23 (FGF‑23) rises early in CKD, preceding phosphate and PTH changes, and drives left‑ventricular hypertrophy and vascular calcification. Asymmetric dimethylarginine (ADMA) accumulates as GFR falls, inhibiting nitric‑oxide synthase and contributing to endothelial dysfunction and rapid CKD progression.
Finally, the extracellular matrix remodeling marker procollagen type III N‑terminal propeptide (PIIINP) reflects active fibrosis. Elevated serum PIIINP has been associated with increased interstitial fibrosis, faster eGFR loss, and higher risk of cardiovascular disease, making it a useful surrogate for renal tissue remodeling in CKD patients.
Multiplex Panels and Multi‑omics: The Future of Precision Nephrology
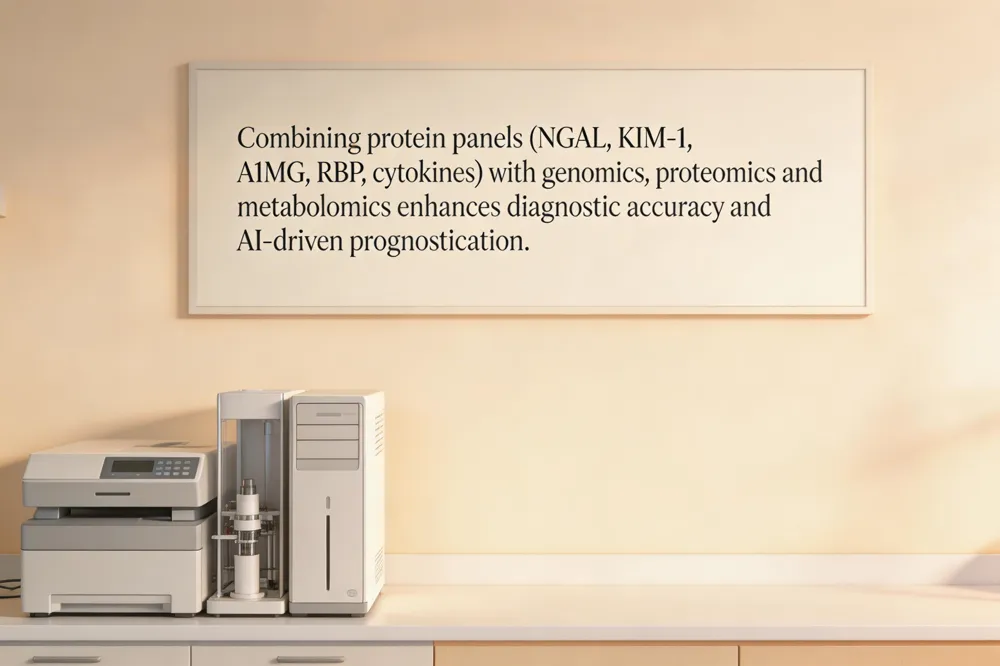
Emerging evidence shows that a single biomarker rarely captures the complex pathophysiology of kidney disease, prompting the development of multiplex panels that combine markers of glomerular filtration, tubular injury, and inflammation. Studies have demonstrated that a panel containing neutrophil gelatinase‑associated lipocalin (NGAL), kidney injury molecule‑1 (KIM‑1), α‑1‑microglobulin (A1MG), retinol‑binding protein (RBP) and inflammatory cytokines such as IL‑18 or MCP‑1 markedly improves diagnostic accuracy for both acute kidney injury (AKI) and chronic kidney disease (CKD) compared with any individual test. The synergistic information from these markers reflects real‑time tubular damage, protein reabsorption failure, and systemic inflammatory response, allowing earlier risk stratification and more precise therapeutic decisions.
Beyond protein panels, integration of genomics, proteomics and metabolomics—collectively termed multi‑omics has accelerated the discovery of novel renal biomarkers. High‑throughput sequencing identifies genetic variants that predispose to CKD, while proteomic profiling uncovers disease‑specific peptide signatures (e.g., CKD273), and metabolomics highlights altered amino‑acid and lipid pathways that precede overt GFR decline. When these data streams are fed into Artificial intelligence and machine learning algorithms, predictive models can synthesize thousands of variables to forecast disease trajectory, dialysis need, or cardiovascular events with unprecedented accuracy.
However, widespread clinical adoption faces hurdles. Standardization of assay methods across platforms remains essential to reduce inter‑laboratory variability, and universally accepted cut‑off values for each biomarker must be established. Regulatory approval pathways for multiplex and multi‑omics tests are still evolving, requiring rigorous validation studies to demonstrate clinical utility and cost‑effectiveness. Overcoming these challenges will be key to translating precision nephrology from research to routine patient care.
Agam Diagnostics: Delivering High‑Quality Kidney Biomarker Testing
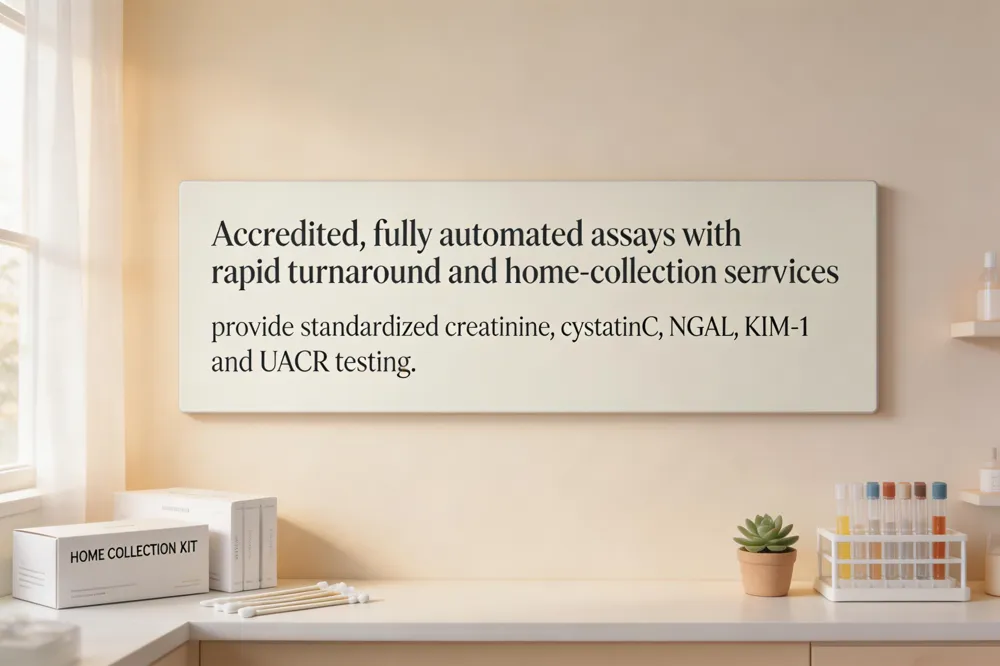
Agam Diagnostics in Madurai meets the highest laboratory standards, holding both NABL and ICMR accreditation, which guarantees that all kidney‑function assays—including serum creatinine, cystatin C, neutrophil gelatinase‑associated lipocalin (NGAL), kidney injury molecule‑1 (KIM‑1) and the urine albumin‑to‑creatinine ratio (UACR)—are performed on fully automated analyzers with tight quality‑control procedures. The laboratory’s robotic platforms reduce pre‑analytical variability and deliver reproducible, high‑throughput results. To enhance patient convenience, Agam Diagnostics offers free home‑collection of blood and urine specimens, with most reports generated within six hours of receipt, enabling clinicians to act promptly. All eGFR values are calculated using the CKD‑EPI equations—both creatinine‑based and combined creatinine‑cystatin C formulas—providing standardized, race‑neutral estimates that improve risk stratification for chronic kidney disease. These integrated services ensure accurate, rapid, and reliable kidney‑health assessment for patients across India.
Practical Guidance for Clinicians and Patients
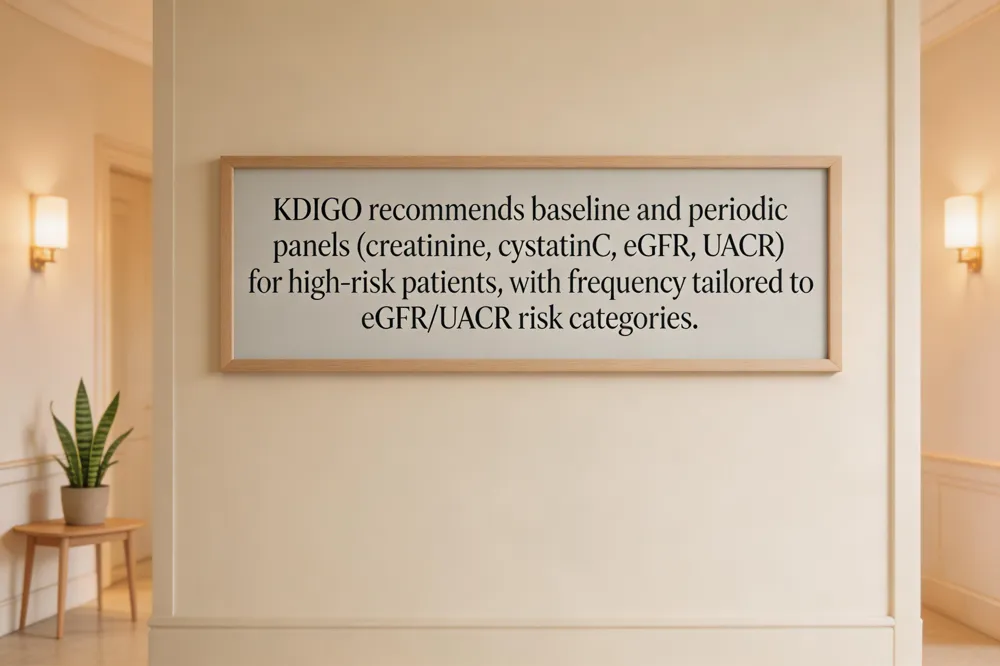
When to order a renal panel – KDIGO recommends routine kidney screening for individuals at high risk of CKD, notably patients with diabetes, hypertension, or those receiving nephrotoxic drugs (e.g., certain antibiotics, NSAIDs, chemotherapy). Early testing should include serum creatinine, cystatin C, estimated GFR (eGFR) using the CKD‑EPI equation, and urine albumin‑to‑creatinine ratio (UACR). In diabetic and hypertensive cohorts, the 2024 KDIGO guideline advises a baseline panel at diagnosis and repeat testing at least annually; more frequent testing (every 3‑6 months) is warranted when eGFR <60 mL/min/1.73 m² or UACR ≥30 mg/g.
Interpretation of eGFR, UACR, and emerging biomarkers – eGFR ≥90 mL/min/1.73 m² is considered normal; 60‑89 mL/min/1.73 m² indicates mild reduction, while <60 signals CKD. UACR <30 mg/g is normal; 30‑300 mg/g reflects moderately increased albuminuria (KDIGO A2) and >300 mg/g signals severely increased albuminuria (A3). Adding cystatin C improves GFR accuracy, especially in low‑muscle‑mass patients. Emerging tubular injury markers such as NGAL, KIM‑1, and L‑FABP can detect early tubular damage and may be used when conventional tests are equivocal or to stratify AKI risk in critically ill patients.
Frequency of monitoring based on KDIGO risk categories – KDIGO risk stratification combines eGFR and UACR. For low‑risk (eGFR ≥60 + UACR <30 mg/g), annual monitoring suffices. Moderate risk (eGFR 45‑59 + UACR 30‑300 mg/g) warrants 6‑month intervals. High risk (eGFR <45 + UACR >300 mg/g) or rapid eGFR decline (>5 mL/min/1.73 m² per year) requires 3‑month follow‑up. Incorporating novel biomarkers (e.g., rising NGAL or KIM‑1) may prompt earlier re‑assessment even when eGFR is stable.
Lifestyle and therapeutic interventions to slow CKD progression – Blood pressure control (<120/80 mm Hg) and optimal glycemic management (HbA1c <7%) remain cornerstone measures. Dietary sodium restriction (<2 g/day), adequate hydration, and avoidance of high‑protein excess reduce renal workload. ACE inhibitors or ARBs are first‑line for proteinuric CKD, decreasing albuminuria and slowing eGFR decline. Smoking cessation, regular aerobic exercise, and weight management further lower cardiovascular and renal risk. Patients should be educated on medication adherence, the importance of regular biomarker testing, and early reporting of symptoms such as edema or changes in urine output.
Economic Impact of Early Biomarker‑Driven Intervention
Early detection of kidney injury using emerging biomarkers such as neutrophil gelatinase‑associated lipocalin (NGAL), kidney injury molecule‑1 (KIM‑1) and cystatin C can be highly cost‑effective. [NGAL] and [KIM‑1] rise within hours of tubular damage, allowing clinicians to intervene before serum creatinine and, avoid costly progression to end‑stage kidney disease. [Cystatin C] provides a more accurate estimate of glomerular filtration than creatinine, especially in patients with low muscle mass, reducing unnecessary repeat testing and medication adjustments. In India, where dialysis and transplantation each cost tens of thousands of dollars per year, preventing even a modest proportion of CKD patients from reaching these stages could save billions in health‑care expenditures. National screening programs that incorporate urine albumin‑to‑creatinine ratio (UACR) together with a panel of [NGAL], [KIM‑1] and [cystatin C]—performed in accredited, high‑throughput labs such as Agam Diagnostics—can identify high‑risk individuals early, enable timely lifestyle or therapeutic measures, and lower the downstream burden on dialysis centres and transplant registries. Policymakers should therefore prioritize the inclusion of multi‑biomarker panels in CKD surveillance guidelines, allocate funding for community‑level home collection services, and incentivize laboratories to adopt standardized, automated assays. Such strategies will accelerate early diagnosis, improve patient outcomes, and generate substantial savings for India's public‑health system.
Putting Precision Biomarkers into Everyday Care
Integrating traditional kidney tests—serum creatinine, BUN, eGFR, and urine albumin‑to‑creatinine ratio—with emerging markers such as cystatin C, NGAL, KIM‑1, L‑FABP, and the TIMP‑2 × IGFBP‑7 product creates a multidimensional picture of glomerular filtration, tubular injury, and early inflammation. This synergy improves early detection of acute kidney injury and chronic disease progression far beyond what any single assay can achieve.
Agam Diagnostics in Madurai operationalizes this precision approach by offering fully automated, NABL‑ and ICMR‑accredited panels that combine creatinine‑based eGFR, cystatin C‑derived GFR, and urinary biomarkers (UACR, NGAL, KIM‑1, α‑1‑microglobulin). Free home collection and rapid 6‑hour turn‑around democratize access for patients in remote or underserved regions, ensuring that clinicians receive reliable, standardized results for timely decision‑making.
Looking ahead, AI‑driven dashboards will aggregate longitudinal biomarker data, electronic health records, and imaging to generate personalized risk scores. Expanded panels—including proteomic, metabolomic, and microRNA signatures—will be seamlessly integrated into cloud‑based platforms, enabling continuous, patient‑centric monitoring and proactive therapeutic adjustments before overt renal failure manifests.
Introduction
Clinical microbiology laboratories isolate, identify, and test the susceptibility of bacteria, fungi, viruses, and parasites from patient specimens such as blood, urine, sputum, stool, and wound swabs. These tests—Gram stain, culture, rapid antigen detection, PCR, and MALDI‑TOF—provide the definitive diagnoses needed to guide targeted antimicrobial therapy, support stewardship, and curb resistance. In Madurai, Agam Diagnostics embodies this role by offering a fully automated, NABL‑ and ICMR‑accredited microbiology suite that includes blood‑culture systems, urine and sputum cultures, molecular PCR panels, and rapid antigen tests. Free home collection and rapid turnaround further ensure timely, accurate results for patients across urban and rural Tamil Nadu.
Blood Cultures and Sepsis Management
Blood culture is the gold‑standard test for detecting bacteremia and fungemia, allowing early identification of pathogens such as Staphylococcus aureus, Escherichia coli and Candida species. For suspected endocarditis, three sets of aerobic and anaerobic bottles should be drawn from separate sites within two hours, achieving >95 % detection.(For suspected endocarditis, three blood culture sets within two hours increase detection to >95‑99% positive yield in untreated patients. Proper collection requires aseptic technique, adequate blood volume (8‑10 mL per adult bottle), and timing before antibiotics.(Blood cultures require two bottles (aerobic and anaerobic) per set, with each bottle containing 8–10 mL of blood for adults, to maximize pathogen detection. Once a bottle flags positive, rapid identification methods—MALDI‑TOF, PCR panels, or Sepsityper kits—provide organism data within hours,(MALDI‑TOF mass spectrometry identifies cultured isolates in hours for $15‑30 per specimen and MALDI‑TOF with Sepsityper® kit rapidly identifies organisms from positive blood cultures while susceptibility testing (disk diffusion, broth microdilution, automated systems) adds minimum inhibitory concentrations.(Antibiotic susceptibility (culture and sensitivity) testing determines the minimum inhibitory concentrations of antibiotics against isolated microbes, enabling targeted therapy and reducing the risk of resistance. The combined result guides targeted antimicrobial therapy, shortening empiric broad‑spectrum use, improving patient outcomes, and supporting antimicrobial stewardship.(Rapid and accurate microbiology results are critical for early initiation of effective antimicrobial therapy, which improves patient outcomes and curbs the spread of resistant organisms.
Urine Cultures in Urinary Tract Infections
Specimen collection: A clean‑catch mid‑stream urine sample of at least 4 mL is obtained using a sterile container; proper technique minimizes contamination and preserves organism viability. Quantitative thresholds: Culture results are expressed as colony‑forming units per millilitre (CFU/mL). A count of ≥10⁵ CFU/mL of a single uropathogen (e.g., Escherichia coli, Klebsiella pneumoniae) is considered significant for infection, while lower counts may be reported as colonisation or contamination depending on clinical context. Antimicrobial susceptibility: Following isolation, susceptibility (culture‑and‑sensitivity) testing determines the minimum inhibitory concentrations of antibiotics, enabling clinicians to select targeted therapy and avoid unnecessary broad‑spectrum drug use, thereby improving outcomes and curbing resistance.
What urine sample volume and colony‑count threshold indicate a significant urinary tract infection?
A clean‑catch mid‑stream urine specimen of at least 4 mL is collected; a quantitative culture showing ≥10⁵ CFU/mL of uropathogens such as E. coli or Klebsiella pneumoniae is considered significant.
Why is antimicrobial susceptibility testing essential after a positive urine culture?
Antimicrobial susceptibility testing (culture and sensitivity) determines the minimum inhibitory concentrations of antibiotics against the isolated organism, allowing targeted therapy and reducing the use of broad‑spectrum agents.
Respiratory Tract Specimens: Sputum, Nasal Swabs, and Throat Swabs
Proper sputum collection is essential for reliable diagnosis of lower‑respiratory infections. The patient should first rinse the mouth, then take a deep cough and expectorate a specimen into a sterile container. Laboratory assessment looks for few squamous epithelial cells and abundant polymorphonuclear leukocytes; samples meeting these criteria are processed for Gram stain and culture, reducing contamination and improving pathogen recovery.
Nasal swabs, preferably flocked and placed in universal transport media, are used for both viral PCR panels (influenza, RSV, SARS‑CoV‑2) and bacterial carrier detection (e.g., MRSA). Rapid multiplex assays can deliver results within 1‑2 hours, guiding early antiviral or antimicrobial therapy.
Group A Streptococcus (GAS) pharyngitis is definitively diagnosed by throat swab culture, the gold‑standard method. In practice, Rapid antigen detection tests (RADTs) are widely employed for same‑day results, while culture confirms negative RADTs and provides susceptibility data. Laboratories such as Agam Diagnostics in Madurai offer free home collection, automated processing, and NABL/ICMR‑accredited rapid turnaround, ensuring timely, accurate respiratory pathogen identification.
Stool and gastrointestinal pathogen detection is a cornerstone of infectious‑disease diagnostics. Routine enteric bacterial cultures use selective media such as MacConkey and XLD agar to isolate Salmonella, Shigella, Campylobacter and pathogenic Escherichia coli, which are the most common causes of gastroenteritis and dysentery. Parallel parasite identification employs concentrated stool specimens examined by microscopy for ova, cysts and trophozoites of Giardia, Entamoeba and helminths, often supplemented by antigen or PCR assays for increased sensitivity. The combined bacterial and parasitic data not only guide targeted antimicrobial or antiparasitic therapy but also feed public‑health surveillance systems. By pinpointing the exact organism, laboratories enable clinicians to implement appropriate infection‑control measures, while health authorities can track outbreak trends, issue advisories and allocate resources for water‑sanitation interventions. In regions such as Madurai, where water‑borne diarrheal disease is prevalent, rapid reporting of stool culture results is essential for timely outbreak response and disease prevention.
Advanced Diagnostics: Molecular Panels, MALDI‑TOF, and Automation
PCR multiplex panels enable simultaneous detection of 8‑20 respiratory or gastrointestinal pathogens, including key resistance genes, within 1‑8 hours. This rapid, comprehensive data guides clinicians to de‑escalate broad‑spectrum antibiotics early, supporting antimicrobial stewardship and improving outcomes. MALDI‑TOF mass spectrometry identifies bacterial and yeast isolates in ≈40 minutes with genus‑level accuracy > 98 % and species‑level accuracy > 96 %, far faster than traditional biochemical methods that can take days. Automated culture platforms such as BD Kiestra TLA, Copan WASPLab, and BACTEC systems standardize inoculation, reduce manual errors, and cut incubation times by 2‑30 hours, Deliver integrated workflow—from automated specimen processing to MALDI‑TOF and multiplex PCR—shortens the overall turnaround time from 48‑96 hours (conventional culture + susceptibility) to under 24 hours for many infections, enabling earlier targeted therapy and better patient prognoses.
Conclusion
Key takeaways: Microbiology testing remains the cornerstone of infectious‑disease diagnosis, providing rapid identification of bacteria, fungi, parasites and resistance genes from specimens such as blood, urine, sputum, stool and wound tissue. Timely culture and susceptibility results (24‑48 hours for routine isolates, an additional 24‑48 hours for AST) enable clinicians to initiate targeted antimicrobial therapy, curb the spread of resistance and improve patient outcomes. Advanced tools—MALDI‑TOF, automated blood‑culture systems, multiplex PCR panels and next‑generation sequencing—shorten turnaround times, increase detection rates and support antimicrobial‑stewardship programs. Proper specimen collection, labeling and transport are essential for accurate results, and accreditation (NABL, ICMR, ISO 15189) guarantees adherence to international quality standards.
Agam Diagnostics' commitment: Situated in Madurai, Tamil Nadu, Agam Diagnostics offers a fully automated microbiology suite that integrates rapid identification platforms (MALDI‑TOF, VITEK, BACTEC) with molecular diagnostics. The laboratory is NABL‑ and ICMR‑accredited, follows strict ICMR specimen‑handling guidelines, and provides free home collection to eliminate access barriers. Rapid turnaround (routine cultures within 24–48 hours) and online reporting empower clinicians to make evidence‑based treatment decisions promptly, thereby reducing hospital stays, limiting unnecessary broad‑spectrum antibiotic use and supporting public‑health surveillance in the region.
Why RT‑PCR Remains the Gold Standard
RT‑PCR detects SARS‑CoV‑2 RNA with analytical sensitivity that can identify a few hundred copies per millilitre, far surpassing antigen tests and guaranteeing near‑perfect specificity when proper controls are used. Its ability to amplify viral RNA from nasopharyngeal or oropharyngeal swabs—specimens that carry the highest viral load during the first week of illness—makes it the most reliable method for early diagnosis. International health agencies (WHO, CDC, ICMR) and accredited laboratories such as Agam Diagnostics (NABL‑ and ICMR‑certified) endorse RT‑PCR as the definitive molecular test, supporting case confirmation, contact tracing, and outbreak containment. Because the assay can be rapidly adapted to emerging variants and provides quantitative cycle‑threshold values that guide clinical decision‑making, RT‑PCR remains indispensable for both individual patient care and public‑health surveillance.
Understanding RT‑PCR Technology
What does RT‑PCR stand for and how does it work?
RT‑PCR stands for reverse‑transcription polymerase chain reaction. The assay first converts SARS‑CoV‑2 viral RNA into complementary DNA (cDNA) using reverse transcriptase. The cDNA then undergoes PCR amplification: each cycle includes denaturation (≈95 °C), primer annealing (≈58 °C), and extension, exponentially multiplying the target sequences. Real‑time fluorescence detection – either probe‑based (e.g., TaqMan) or intercalating dyes – monitors product formation cycle‑by‑cycle, generating a cycle‑threshold (Ct) value that reflects viral load.
Principle of reverse transcription
Reverse transcriptase synthesizes cDNA from RNA, preserving the viral genetic information for DNA‑based amplification. This step is crucial because conventional PCR can only amplify DNA.
Amplification process
Repeated thermal cycling amplifies the target region, producing billions of copies. The fluorescence signal rises proportionally, allowing quantitative interpretation.
Real‑time fluorescence detection
Fluorescent probes emit light when hybridized to the amplicon, enabling continuous monitoring without opening tubes, thus reducing contamination risk.
One‑step versus two‑step RT‑PCR
In One‑step RT‑PCR, reverse transcription and amplification occur in a single tube, shortening turnaround and limiting handling errors. Two‑step RT‑PCR separates cDNA synthesis from PCR, offering higher sensitivity and flexibility for multiplexing, albeit with a longer workflow.
Specimen Types and Timing
Upper‑respiratory tract samples—nasopharyngeal (NP) and oropharyngeal (OP) swabs— provide the highest detection rate for SARS‑CoV‑2 because viral loads are greatest in the nasopharynx during the first week of illness. Sputum and deep nasal swabs also show high viral concentrations, especially within the first 14 days, while throat swabs become reliable only after 7‑8 days of symptoms.
Optimal collection window – The most reliable sampling period is 5‑7 days after symptom onset or at least five full days after a known exposure. Viral RNA peaks in the first week and then declines; testing too early (within 48 hours of exposure) or too late (after day 10‑14) raises the risk of false‑negative results.
Alternative specimens – Saliva and sputum are accepted in many laboratories and can approximate the sensitivity of NP/OP swabs when collected correctly, but NP/OP swabs remain the preferred standard for maximal detection accuracy.
Interpreting Results and Ct Values
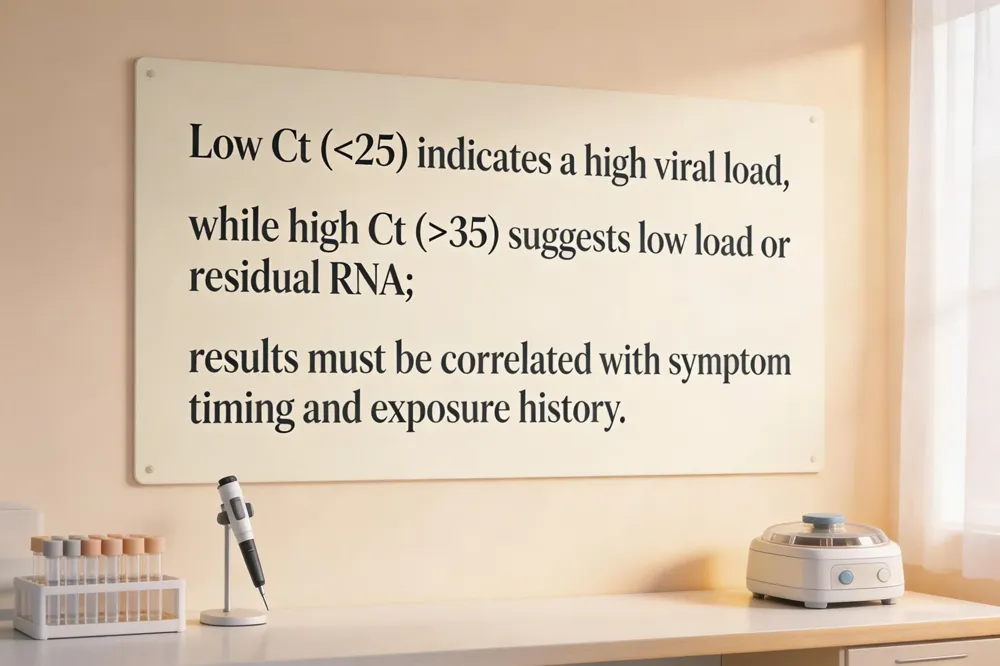
The cycle threshold (Ct) is the PCR cycle at which the fluorescent signal first crosses a preset detection limit. Because each cycle doubles the amount of amplified product, Ct is inversely proportional to the quantity of viral RNA present: low Ct values (e.g., < 25) reflect a high viral load, whereas high Ct values (e.g., > 35) indicate a low viral load or only residual RNA fragments. Estimating viral load from Ct requires a calibrated standard curve, but in routine diagnostics the Ct itself serves as a semi‑quantitative proxy. High Ct values must be interpreted cautiously; they may arise when the sample is taken late in infection, after viral clearance, or when the assay is approaching its limit of detection. In such cases, clinical correlation with symptom timing, exposure history, and, if needed, repeat testing is essential to determine whether the patient is still infectious. Thus, Ct values provide valuable insight into viral dynamics, but they are not standalone diagnostic conclusions.
Accuracy, Sensitivity, and False Results
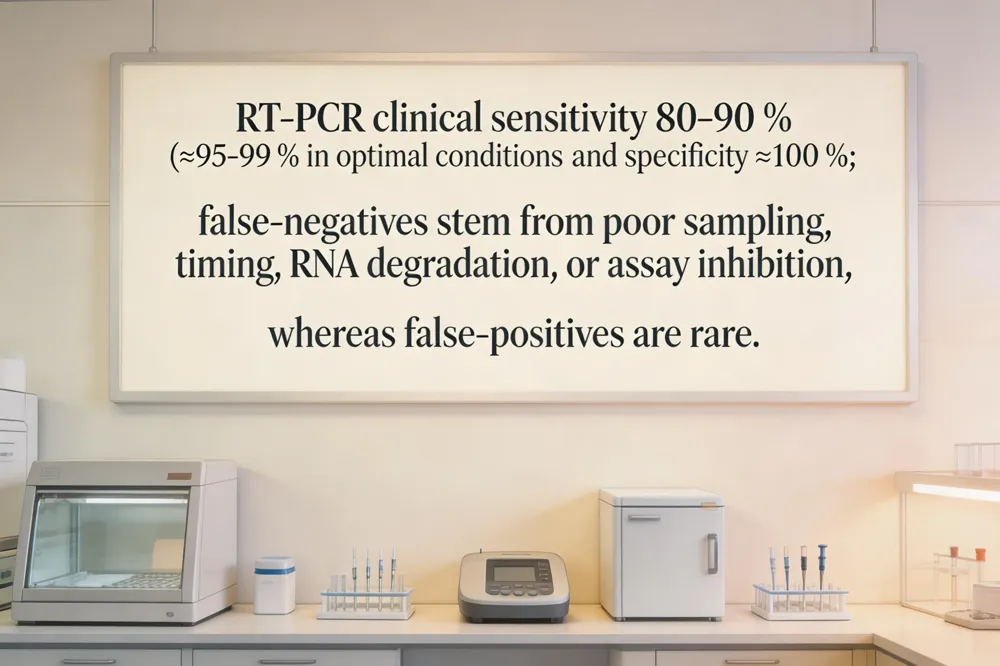
RT‑PCR remains the gold‑standard molecular test for COVID‑19 offers analytical sensitivities that can detect as few as 100–500 copies of viral RNA per reaction and clinical sensitivities of 80‑90 % when the virus is present. In contrast, rapid antigen tests typically achieve 70‑80 % sensitivity and may miss more than 15 % of infections, especially in asymptomatic individuals. Specificity of RT‑PCR is near 100 %, with false‑positive rates below 1 % because the assay targets conserved viral gene regions and employs probe‑based detection. False‑negative RT‑PCR results arise most commonly from improper sample collection (shallow nasopharyngeal swab, inadequate rotation), testing too early or too late when viral load is low, RNA degradation during transport or storage, mutations in primer‑probe binding sites, and technical issues such as reagent failure or inhibition. Rare false‑positive outcomes result from laboratory contamination, cross‑reactivity with other coronaviruses, or detection of residual non‑viable RNA after recovery; stringent quality‑control measures—including no‑template controls, minus‑RT controls, and internal extraction controls—minimize this risk.
Turnaround Time and Laboratory Workflow
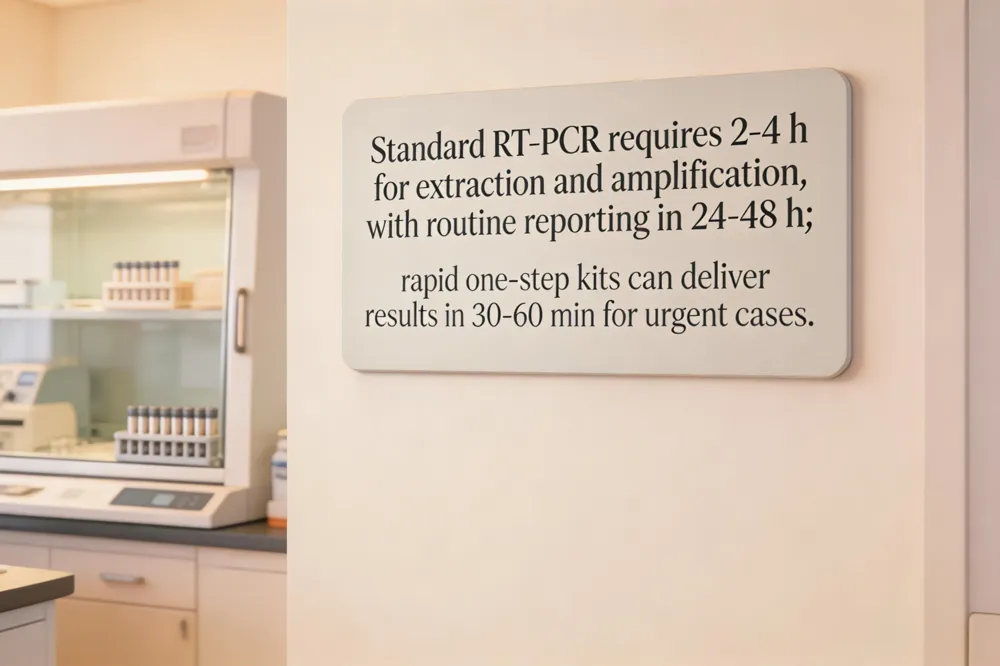
Standard RT‑PCR assays for SARS‑CoV‑2 require 2‑4 hours for RNA extraction, reverse transcription, and amplification. After the sample reaches the laboratory, most accredited facilities (e.g., NABL‑ and ICMR‑accredited labs such as Agam Diagnostics) report results within 24‑48 hours, allowing time for specimen receipt, quality‑control checks, and electronic delivery. High‑throughput automated platforms further compress the workflow by integrating magnetic‑bead extraction and real‑time PCR in a single‑run format, enabling many hundreds of samples to be processed daily and reducing hands‑on time. For urgent cases, Rapid one‑step RT‑PCR kits combine reverse transcription and amplification in a single reaction, delivering results in 30‑60 minutes; these assays have a slightly higher limit of detection but retain high specificity. Laboratories can therefore offer a tiered service: routine testing with a 1‑2‑day turnaround, and same‑day or sub‑2‑hour reporting for critical patients, emergency departments, or outbreak investigations.
Home Collection and Quality Assurance at Agam Diagnostics
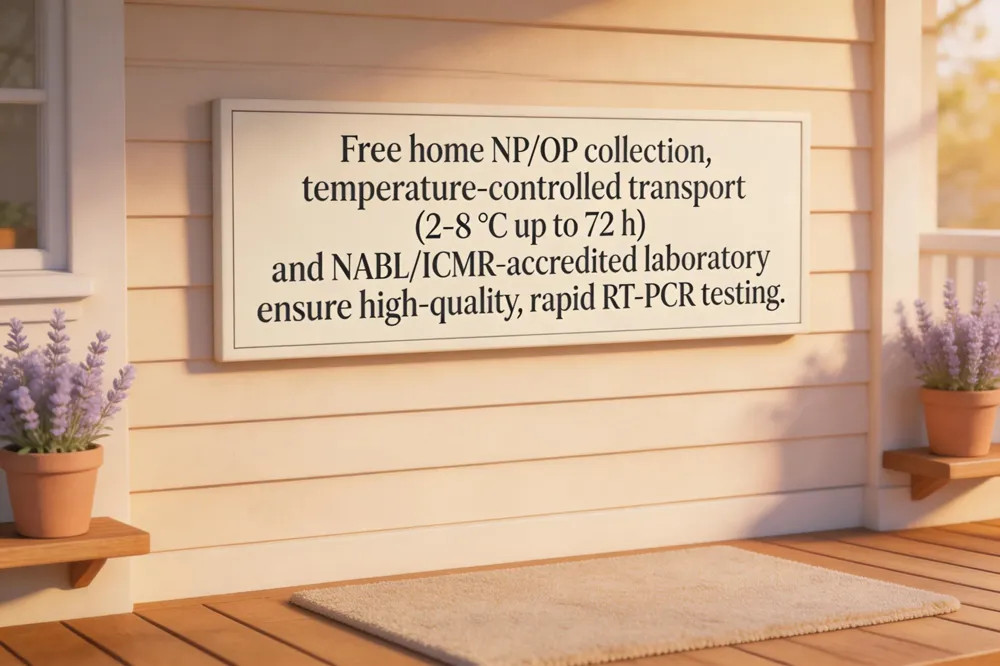
Agam Diagnostics offers free home‑collection of nasopharyngeal (NP) and oropharyngeal (OP) swabs, allowing patients to stay at home while a trained phlebotomist obtains the specimen. This service eliminates travel, reduces exposure risk, and ensures that samples are collected promptly after symptom onset or exposure. Each swab is placed in viral transport medium, sealed, and placed in a temperature‑controlled container that maintains 2‑8 °C for up to 72 hours, preserving RNA integrity before the specimen reaches the laboratory.
The laboratory operates under NABL and ICMR accreditation, which mandates strict adherence to standardized protocols, routine proficiency testing, and documented quality‑control measures. Accreditation guarantees that the RT‑PCR assay meets high sensitivity (≈95‑99 %) and specificity (>99 %) thresholds, and that results are reproducible across batches.
Upon arrival, samples undergo automated RNA extraction on high‑throughput platforms, followed by real‑time RT‑PCR with built‑in internal controls (e.g., RNase P). Results are generated within 4‑6 hours and delivered electronically, providing rapid, reliable diagnosis while maintaining the highest laboratory standards.
Common Misconceptions and FAQs
RT‑PCR remains the gold‑standard molecular test, while rapid antigen kits detect viral proteins. PCR’s analytical sensitivity (detecting a few RNA copies) yields >95 % sensitivity, whereas antigen tests though delivering results in 15‑30 minutes, capture only 70‑80 % of infections, especially in asymptomatic or early disease.
Does a negative PCR result always rule out COVID‑19? No. A negative PCR result reflects the viral load at the moment of sampling. Testing within 48 hours of exposure, using a shallow swab, or sampling after viral clearance can produce false‑negatives. If symptoms appear or exposure risk stays high, repeat PCR after 48‑72 hours is advised.
Can RT‑PCR detect emerging SARS‑CoV‑2 variants? Most RT‑PCR assays target conserved regions (N, E, RdRp). Manufacturers regularly review primer‑probe sets against circulating SARS‑CoV‑2 genomes to retain detection of new variants such as Delta and Omicron. However, mutations in binding sites can reduce sensitivity, so laboratories monitor genomic data and adjust assays as needed.
How does PCR differ from rapid antigen tests? PCR amplifies viral RNA, offering high sensitivity and specificity, but requires laboratory processing and a 4‑24‑hour turnaround. Rapid antigen tests detect viral proteins, give immediate results, but miss a substantial proportion of low‑viral‑load cases; negative antigen results in symptomatic individuals should be confirmed by PCR.
Key Takeaways and Next Steps
RT‑PCR remains the gold‑standard diagnostic for COVID‑19 because it amplifies viral RNA with high sensitivity (≈95‑99 %) and specificity (>99 %). The test is most reliable when performed on nasopharyngeal or oropharyngeal swabs collected within the first 5‑7 days of symptom onset; viral load peaks in sputum and nasal swabs during the first two weeks, while throat swabs become reliable only after 7‑8 days. Improper technique, delayed transport, or using the wrong swab type can cause false‑negative results. Agam Diagnostics in Madurai offers NABL‑ and ICMR‑accredited free home‑collection of NP/OP swabs, automated RNA extraction, and rapid reporting (often within 24 hours). If symptoms persist despite a negative RT‑PCR, seek a healthcare professional for repeat testing, clinical evaluation, or alternative diagnostics such as antigen or serology assays.
First Step: Preparing for Your Allergy Evaluation
Before the first allergist appointment, bring a concise medical history that lists previous reactions, known triggers, family history of allergies or asthma, and any chronic conditions such as eczema. Review current medications—especially antihistamines, tricyclic antidepressants, H2‑blockers, and biologics—and be prepared to stop those that can suppress a skin prick response (typically 3–7 days before testing) as instructed by the physician. Keep an allergy diary for at least two weeks, noting symptom timing, severity, possible exposure, and any foods or environments that seem linked to flare‑ups; this diary helps the clinician correlate test results with real‑world triggers. If a blood‑based IgE panel is ordered, Agam Diagnostics offers free home collection of the specimen, ensuring a convenient, safe draw and rapid turnaround of results.
Understanding the Tests: Skin Prick, Intradermal, and Blood IgE

Allergy evaluation at Agam Diagnostics follows a stepwise approach that begins with a detailed history and physical exam, then proceeds to the most appropriate test based on the patient’s symptoms and medication profile. The skin prick test (SPT) is the first‑line, minimally invasive method: drops of standardized allergen extracts are placed on the forearm or upper back, a sterile lancet makes a tiny puncture, and a wheal is measured after 15‑20 minutes. A wheal larger than the saline control and comparable to the histamine positive control indicates sensitisation. When SPT results are negative or inconclusive but clinical suspicion remains high, an intradermal test is performed; a diluted allergen is injected just beneath the epidermis, providing greater sensitivity for insect‑venom or penicillin allergies, with readings taken at 15‑20 minutes. For patients who cannot discontinue antihistamines, have extensive eczema, or prefer a blood‑based assay, Agam Diagnostics offers serum specific IgE testing using automated ELISA or ImmunoCAP platforms. These assays quantify IgE antibodies to individual allergens, and component‑resolved diagnostics can further pinpoint IgE reactivity to specific allergen proteins, guiding precise avoidance and immunotherapy strategies.
Laboratory Excellence: Agam Diagnostics' Quality and Convenience

Agam Diagnostics, situated in Madurai, Tamil Nadu, operates a fully automated pathology laboratory that meets the highest international standards. The facility holds dual accreditation from the National Accreditation Board for Testing and Calibration Laboratories (NABL) and the Indian Council of Medical Research (ICMR), guaranteeing that every immunology and allergy assay follows rigorous quality‑control protocols and complies with ISO‑15189 requirements. Its automated immunoassay platforms—capable of ELISA, CLIA and other high‑throughput techniques—minimize human handling, reduce error rates, and ensure reproducible quantitative results for serum specific IgE, total IgE and component‑resolved diagnostics. Because the laboratory workflow is streamlined, test reports are generated within 24 to48 hours of sample receipt, allowing clinicians to make timely therapeutic decisions. To further enhance patient convenience, Agam Diagnostics offers free home collection of blood specimens, eliminating the need for travel and preserving specimen integrity. Together, these features—accreditation, automation, rapid turnaround and home phlebotomy—make Agam Diagnostics a reliable, patient‑focused partner for allergy and immunology testing.
Preparing for Skin Testing: Medication and Safety
Before a skin prick or intradermal allergy test, patients should stop antihistamines for at least 48–72 hours (often 5 days) to avoid suppressing the wheal response and producing false‑negative results. Other drugs that can interfere include tricyclic antidepressants, certain H2‑blockers (e.g., ranitidine), and biologic agents such as omalizumab; these should be discontinued under the allergist’s guidance, typically a week before testing. The testing suite is equipped with emergency equipment—including epinephrine pens, antihistamines, and corticosteroids—to manage the rare possibility of anaphylaxis, and staff continuously monitor patients for systemic reactions during the observation period. In addition, Agam Diagnostics follows strict COVID‑19 biosafety protocols: mandatory masking, hand‑sanitization, and surface disinfection are enforced for both staff and patients to protect against viral transmission while maintaining a safe environment for allergy evaluation.
Interpreting Results: From IgE Levels to Clinical Decisions

Agam Diagnostics quantifies specific IgE antibodies using automated ELISA/CLIA platforms, delivering numeric values that are matched to an interpretation guide. A result above the laboratory‑defined cut‑off (typically ≥0.35 kU/L) is reported as "positive", values below the cut‑off as "negative", and those hovering around the threshold as "borderline". Positive IgE indicates sensitisation but does not prove clinical allergy; this is why the allergist always correlates the laboratory data with the patient’s detailed history, symptom diary, and exposure pattern. For example, a high IgE to dust‑mite extract gains relevance only if the patient reports year‑round nasal congestion and wheezing. Once an allergen is confirmed, three management pathways are offered: (1) strict avoidance of the identified trigger, (2) pharmacotherapy such as antihistamines, intranasal steroids, or leukotriene modifiers to control symptoms, and (3) allergen‑specific immunotherapy (subcutaneous or sublingual) to modify the immune response over time. Agam Diagnostics’ rapid 24‑48‑hour turnaround and free home collection enable the allergist to formulate personalized plans promptly.
Beyond Diagnosis: Ongoing Care and Follow‑Up

After the allergist confirms the triggers, Agam Diagnostics provides a personalized after‑visit summary that lists each positive and negative result, interprets the quantitative IgE levels, and outlines a step‑by‑step management plan. The summary includes clear environmental‑modification counseling—advice on reducing indoor dust‑mite exposure, seasonal pollen avoidance, and strategies for minimizing contact with identified food or insect allergens. Patients are also educated on emergency action plans; the allergist explains when to use an epinephrine auto‑injector, demonstrates its administration, and supplies a written protocol for caregivers and schools. Because allergen sensitisation can change over time, the clinician recommends routine retesting every two to three years, or sooner if new symptoms arise, to monitor IgE trends and adjust therapy. Follow‑up appointments may involve repeat skin prick testing, serum specific IgE panels, or assessment of immunotherapy response, ensuring that the treatment plan remains effective and up‑to‑date.
Your Path to Relief Starts with Accurate Testing
At your first allergist visit, Agam Diagnostics streamlines allergy evaluation with free home collection of blood samples, eliminating travel hassles. The laboratory’s NABL and ICMR accreditation guarantees that every immunoassay, from skin‑prick correlatives to specific IgE ELISA, meets international quality standards, while automated platforms deliver reports within 24‑48 hours. Results are interpreted by qualified pathologists, enabling the physician to craft a personalized management plan that may involve avoidance, medication, or immunotherapy. Trust in Agam’s expertise means confidence that your diagnosis is accurate, timely, and the foundation for lasting relief and improved quality of life for you every day.
